Sustainable Plastic Packaging Market by Packaging Type (Rigid, Flexible, Industrial), Packaging Format (Primary, Secondary, Tertiary), Process (Recyclable, Reusable, Biodegradable), End-use Sector, and Region - Global Forecast to 2025


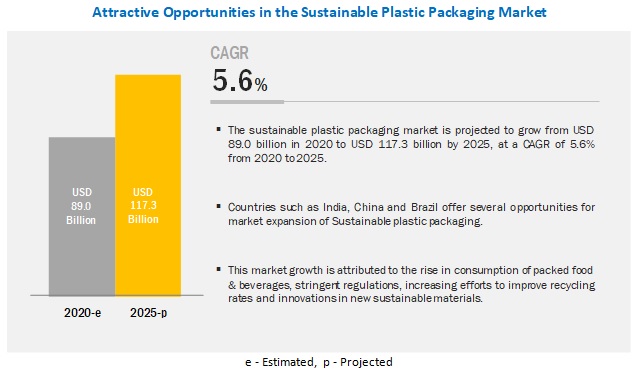
[205 Pages Report] The sustainable plastic packaging market is projected to grow from USD 84.0 billion in 2020 to USD 117.3 billion by 2025, at a CAGR of 5.6% during the forecast period. The market is projected to grow in accordance with the growth of various end-users of sustainable plastic packaging across the globe. The sustainable plastic packaging industry has been growing as a result of stringent laws and regulations levied by governments and governing bodies, as well as a shift in consumer preference toward recyclable and eco-friendly packaging materials. Apart from these factors, downsizing of packaging and breakthrough in new technologies are also driving the sustainable plastic packaging market globally.
In terms of value and volume, the biodegradable segment is estimated to be the fastest-growing process in the sustainable plastic packaging market between 2020 and 2025.
Biodegradable plastic decomposes naturally in the environment. This is achieved when microorganisms in the environment metabolize and break down the structure of biodegradable plastic. It is less harmful to the environment than traditional plastics. Biodegradable plastics can be composed of bioplastics manufactured from renewable raw materials. Innovation plays a key role in the biodegradable plastic packaging market. Several companies are investing in R&D in search of new packaging materials that are beneficial in use and non-toxic to the environment.
The food & beverage segment was the largest end-use sector in the sustainable plastic packaging market in 2019.
Food & beverage is a major industry in the sustainable packaging market. The primary function of food & beverage packaging is to reduce food loss and increase the shelf-life of food products. Global players are aiming at using innovative packaging materials developed from degradable and recyclable materials in order to achieve sustainability. Consumers seek convenience food solutions due to lack of time. The expectations of food quality, hygiene, and growing health awareness are driving the sustainable packaging market in the food & beverage sector.
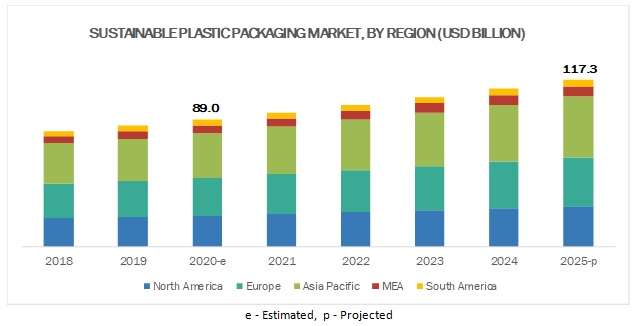
The APAC region is projected to account for the largest share in the sustainable plastic packaging market during the forecast period.
APAC is projected to lead the sustainable plastic packaging market, in terms of both value and volume, between 2020 and 2025. According to the World Bank, in 2017, APAC was the fastest-growing region in terms of both population and economic growth. Countries such as India and China are expected to post high growth in the sustainable plastic packaging market due to growing developmental activities and rapid economic expansion. The growing population in these countries presents a huge customer base for FMCG products and consumer durables.
The growing awareness among the masses about the importance of eco-friendly, renewable packaging, the growing food & beverage industry, and low manufacturing and labor costs are driving the sustainable plastic packaging market in APAC.
Key Market Players
Amcor PLC (Australia) is a global packaging manufacturer that offers innovative and sustainable packaging solutions. Amcor was formerly known as Australian Paper Manufacturers and changed its name to Amcor Limited in May 1986. After the acquisition of Bemis Inc., the combined company is now called Amcor PLC. The company is well known for its packaging innovation. It offers plastic, packaging film, metal, and glass packaging for several industries, such as beverage, food, medical, household, industrial goods, pharmaceuticals, and tobacco. The company caters to the aseptic packaging needs of the food, beverage, and pharma industries. A majority of Amcor’s packaging is already technically recyclable or reusable, and the company has been focusing on designing packaging that uses less materials for the past several years.
Get online access to the report on the World's First Market Intelligence Cloud
- Easy to Download Historical Data & Forecast Numbers
- Company Analysis Dashboard for high growth potential opportunities
- Research Analyst Access for customization & queries
- Competitor Analysis with Interactive dashboard
- Latest News, Updates & Trend analysis
Request Sample Scope of the Report
Get online access to the report on the World's First Market Intelligence Cloud
- Easy to Download Historical Data & Forecast Numbers
- Company Analysis Dashboard for high growth potential opportunities
- Research Analyst Access for customization & queries
- Competitor Analysis with Interactive dashboard
- Latest News, Updates & Trend analysis

|
Report Metric |
Details |
|
Market size available for years |
2018–2025 |
|
Base year considered |
2019 |
|
Forecast period |
2020–2025 |
|
Forecast units |
Value (USD Billion) and Volume (Million Metric Tons) |
|
Segments covered |
Packaging type, packaging format, process, end-use sector, and region |
|
Regions covered |
North America, APAC, Europe, the Middle East & Africa, and South America |
|
Companies covered |
Amcor PLC (Australia), Sonoco Products Company (US), Sealed Air Corporation (US), Huhtamaki OYJ (Finland), and Berry Global Inc. (US) are the key players operating in the sustainable plastic packaging market. |
This research report categorizes the sustainable plastic packaging market based on packaging type, packaging format, process, end-use sector, and region.
Sustainable plastic packaging market, by packaging type:
- Rigid
- Flexible
- Industrial
Sustainable plastic packaging market, by packaging format:
- Primary packaging
- Secondary packaging
- Tertiary packaging
Sustainable plastic packaging market, by process:
- Recyclable
- Reusable
- Biodegradable
Sustainable plastic packaging, by end-use sector:
- Food & beverage
- Personal care
- Healthcare
- Other end-use sectors (electronics and homecare)
Sustainable plastic packaging market, by region:
- North America
- Europe
- APAC
- Middle East & Africa
- South America
Recent Developments
- In February 2020, Amcor PLC launched the first container for Ritual Multivitamins (US) made from 100% Post-Consumer Recycled content (PCR) resin. PCR is composed of recycled materials, including PET beverage bottles that have been used and subsequently recycled to produce a new product. Using PCR helps support the recycling infrastructure and reduces demand on virgin resins.
- In January 2020, Sealed Air Corporation, launched a new version of their bubble wrap brand packaging that is made with at least 90% recycled content. The recycled content used to make this version of bubble wrap brand packaging is sourced from post-industrial materials that would otherwise end up in landfills.
- In October 2019, Sonoco ThermoSafe, a unit of Sonoco Products Company, announced the creation of Orion R, which is a high-performance temperature controlled box rental service. It is made of lightweight, rugged EPP (Expanded Polypropylene), which is substantially more reusable than existing rental parcels and enables the pharmaceutical supply chain to cost-effectively and sustainably ship small parcels globally.
Key Questions Addressed by the Report:
- What are the global trends in the sustainable plastic packaging market? Would the market witness an increase or decline in the demand in the coming years?
- What is the estimated demand for different types of packaging in sustainable plastic packaging?
- Where will the strategic developments take the industry in the mid to long-term?
- What are the upcoming industry applications and trends for sustainable plastic packaging?
- Who are the major players in the sustainable plastic packaging market globally?
To speak to our analyst for a discussion on the above findings, click Speak to Analyst
TABLE OF CONTENTS
1 INTRODUCTION (Page No. - 25)
1.1 OBJECTIVES OF THE STUDY
1.2 MARKET DEFINITION
1.2.1 INCLUSIONS
1.2.2 EXCLUSIONS
1.3 STUDY SCOPE
1.3.1 REGIONAL SCOPE
1.3.2 YEARS CONSIDERED FOR THE STUDY
1.4 CURRENCY CONSIDERED
1.5 UNITS CONSIDERED
1.6 STAKEHOLDERS
2 RESEARCH METHODOLOGY (Page No. - 29)
2.1 RESEARCH DATA
2.2 SECONDARY RESEARCH: SUPPLY SIDE ANALYSIS
2.3 PRIMARY AND SECONDARY RESEARCH (VOLUME MARKET)
2.4 MARKET SIZE ESTIMATION
2.4.1 BOTTOM-UP APPROACH
2.4.2 TOP-DOWN APPROACH
2.5 SECONDARY DATA
2.5.1 KEY DATA FROM SECONDARY SOURCES
2.6 PRIMARY DATA
2.7 RESEARCH ASSUMPTIONS & LIMITATIONS
2.7.1 ASSUMPTIONS
2.7.2 LIMITATIONS
3 EXECUTIVE SUMMARY (Page No. - 34)
3.1 INTRODUCTION
4 PREMIUM INSIGHTS (Page No. - 38)
4.1 ATTRACTIVE OPPORTUNITIES IN THE SUSTAINABLE PLASTIC PACKAGING MARKET
4.2 SUSTAINABLE PLASTIC PACKAGING MARKET, BY PACKAGING TYPE AND COUNTRY
4.3 SUSTAINABLE PLASTIC PACKAGING MARKET, BY COUNTRY
5 MARKET OVERVIEW (Page No. - 41)
5.1 INTRODUCTION
5.2 MARKET DYNAMICS
5.2.1 DRIVERS
5.2.1.1 Government initiatives toward sustainable packaging
5.2.1.2 Shift in consumer preference toward recyclable and eco-friendly materials
5.2.1.3 Downsizing of packaging
5.2.1.4 Breakthrough in new technologies and innovations
5.2.2 RESTRAINTS
5.2.2.1 Poor infrastructure facilities for recycling
5.2.2.2 Lack of awareness about the importance of sustainability in some emerging economies
5.2.2.3 Packaging shifting toward non-plastic solutions
5.2.3 OPPORTUNITIES
5.2.3.1 Growth of the e-commerce industry
5.2.4 CHALLENGES
5.2.4.1 Fluctuations in raw material prices
6 SUSTAINABLE PLASTIC PACKAGING MARKET, BY PACKAGING TYPE (Page No. - 48)
6.1 INTRODUCTION
6.2 RIGID PLASTIC PACKAGING
6.3 FLEXIBLE PLASTIC PACKAGING
6.4 INDUSTRIAL PLASTIC PACKAGING
7 SUSTAINABLE PLASTIC PACKAGING MARKET, BY PACKAGING FORMAT (Page No. - 54)
7.1 INTRODUCTION
7.2 PRIMARY
7.3 SECONDARY
7.4 TERTIARY
8 SUSTAINABLE PLASTIC PACKAGING MARKET, BY PROCESS (Page No. - 57)
8.1 INTRODUCTION
8.2 RECYCLABLE
8.3 REUSABLE
8.4 BIODEGRADABLE
9 SUSTAINABLE PLASTIC PACKAGING MARKET, BY END-USE SECTOR (Page No. - 61)
9.1 INTRODUCTION
9.2 FOOD & BEVERAGES
9.3 PERSONAL CARE
9.4 HEALTHCARE
9.5 OTHER END-USE SECTORS
10 SUSTAINABLE PLASTIC PACKAGING MARKET, BY REGION (Page No. - 65)
10.1 INTRODUCTION
10.2 APAC
10.2.1 CHINA
10.2.1.1 Food processing industry to significantly impact market growth
10.2.2 JAPAN
10.2.2.1 Recycling of plastic waste to drive the market
10.2.3 INDIA
10.2.3.1 Highest plastic recycling rate (60%) in the world
10.2.4 AUSTRALIA
10.2.4.1 Government’s initiative for circular economy for plastics
10.2.5 REST OF APAC
10.3 EUROPE
10.3.1 GERMANY
10.3.1.1 Greater consumer awareness about sustainable products
10.3.2 UK
10.3.2.1 High investments and stringent regulations to boost market growth
10.3.3 FRANCE
10.3.3.1 Need for effective and innovative packaging to drive the market
10.3.4 RUSSIA
10.3.4.1 Increasing number of integrated packaging manufacturers to support the market growth
10.3.5 SPAIN
10.3.5.1 Macroeconomic factors to have positive impacts on the market
10.3.6 REST OF EUROPE
10.4 NORTH AMERICA
10.4.1 US
10.4.1.1 Rising demand for environmentally friendly and recyclable goods
10.4.2 CANADA
10.4.2.1 Demand for greener products and reduced packaging to drive the market
10.4.3 MEXICO
10.4.3.1 Gradual economic recovery likely to influence the market
10.5 MIDDLE EAST & AFRICA
10.5.1 UAE
10.5.1.1 Efforts being taken to eliminate the use of avoidable single-use plastic
10.5.2 SAUDI ARABIA
10.5.2.1 Healthcare to be the fastest-growing end-use sector
10.5.3 SOUTH AFRICA
10.5.3.1 Growing food & beverage industry to support the market growth
10.5.4 REST OF MIDDLE EAST & AFRICA
10.6 SOUTH AMERICA
10.6.1 BRAZIL
10.6.1.1 The most important packaging market in South America
10.6.2 ARGENTINA
10.6.2.1 Expansion in the end-use industries to propel market growth
10.6.3 REST OF SOUTH AMERICA
11 COMPETITIVE LANDSCAPE (Page No. - 138)
11.1 OVERVIEW
11.2 MICRO QUADRANT FOR SUSTAINABLE PLASTIC PACKAGING MANUFACTURERS
11.3 SUSTAINABLE PLASTIC PACKAGING MARKET (GLOBAL) COMPETITIVE LEADERSHIP MAPPING
11.3.1 STRENGTH OF PRODUCT PORTFOLIO OF MAJOR COMPANIES
11.3.2 BUSINESS STRATEGY EXCELLENCE OF MAJOR COMPANIES
11.2 COMPETITIVE SCENARIO
11.2.1 MERGERS & ACQUISITIONS
11.2.2 EXPANSIONS & INVESTMENTS
11.2.3 PARTNERSHIPS & JOINT VENTURES
11.2.4 NEW PRODUCT DEVELOPMENTS
12 COMPANY PROFILES (Page No. - 154)
12.1 AMCOR PLC
12.1.1 BUSINESS OVERVIEW
12.1.2 FINANCIAL ASSESSMENT
12.1.3 OPERATIONAL ASSESSMENT
12.1.4 PRODUCTS OFFERED
12.1.5 RECENT DEVELOPMENTS
12.1.6 SWOT ANALYSIS
12.1.7 CURRENT FOCUS AND STRATEGIES
12.1.8 AMCOR’S RIGHT TO WIN
12.2 SONOCO PRODUCTS COMPANY
12.2.1 BUSINESS OVERVIEW
12.2.2 FINANCIAL ASSESSMENT
12.2.3 OPERATIONAL ASSESSMENT
12.2.4 PRODUCTS OFFERED
12.2.5 RECENT DEVELOPMENTS
12.2.6 SWOT ANALYSIS
12.2.7 CURRENT FOCUS AND STRATEGIES
12.2.8 SONOCO PRODUCTS COMPANY’S RIGHT TO WIN
12.3 SEALED AIR CORPORATION
12.3.1 BUSINESS OVERVIEW
12.3.2 FINANCIAL ASSESSMENT
12.3.3 OPERATIONAL ASSESSMENT
12.3.4 PRODUCTS OFFERED
12.3.5 RECENT DEVELOPMENTS
12.3.3 SWOT ANALYSIS
12.3.4 CURRENT FOCUS AND STRATEGIES
12.3.5 SEALED AIR CORPORATION’S RIGHT TO WIN
12.4 HUHTAMAKI OYJ
12.4.1 BUSINESS OVERVIEW
12.4.2 FINANCIAL ASSESSMENT
12.4.3 OPERATIONAL ASSESSMENT
12.4.4 PRODUCTS & SERVICES OFFERED
12.4.5 RECENT DEVELOPMENTS
12.4.6 SWOT ANALYSIS
12.4.7 CURRENT FOCUS AND STRATEGIES
12.4.8 HUHTAMAKI’S RIGHT TO WIN
12.5 BERRY GLOBAL GROUP INC.
12.5.1 BUSINESS OVERVIEW
12.5.2 FINANCIAL ASSESSMENT
12.5.3 OPERATIONAL ASSESSMENT
12.5.4 PRODUCTS OFFERED
12.5.5 RECENT DEVELOPMENTS
12.5.6 SWOT ANALYSIS
12.5.7 CURRENT FOCUS AND STRATEGIES
12.5.8 BERRY GLOBAL’S RIGHT TO WIN
12.6 SMURFIT KAPPA
12.6.1 BUSINESS OVERVIEW
12.6.2 FINANCIAL ASSESSMENT
12.6.3 OPERATIONAL ASSESSMENT
12.6.4 PRODUCTS OFFERED
12.6.5 RECENT DEVELOPMENTS
12.6.6 SWOT ANALYSIS
12.6.7 CURRENT FOCUS AND STRATEGIES
12.6.8 SMURFIT KAPPA’S RIGHT TO WIN
12.7 MONDI PLC
12.7.1 BUSINESS OVERVIEW
12.7.2 FINANCIAL ASSESSMENT
12.7.3 OPERATIONAL ASSESSMENT
12.7.4 PRODUCTS OFFERED
12.7.5 RECENT DEVELOPMENTS
12.7.6 MONDI’S RIGHT TO WIN
12.8 UFLEX LTD.
12.8.1 BUSINESS OVERVIEW
12.8.2 PRODUCTS OFFERED
12.8.3 RECENT DEVELOPMENTS
12.8.4 UFLEX’S RIGHT TO WIN
12.9 CONSTANTIA FLEXIBLES
12.9.1 BUSINESS OVERVIEW
12.9.2 PRODUCTS OFFERED
12.9.3 RECENT DEVELOPMENTS
12.9.4 CONSTANTIA FLEXIBLES GROUP’S RIGHT TO WIN
12.10.1 BUSINESS OVERVIEW
12.10.2 PRODUCTS OFFERED
12.10.3 APTARGROUP’S RIGHT TO WIN
13 ADDITIONAL COMPANY PROFILES (Page No. - 193)
13.1 GENPAK LLC
13.2 PLASTIC SUPPLIERS INC.
13.3 NATUREWORKS LLC
13.4 PHOENIX TECHNOLOGIES INTERNATIONAL LLC
13.5 NOVAMONT S.P.A
13.6 INNOVIA FILMS
13.7 ESSEL PROPACK
13.8 GERRESHEIMER AG
13.9 TETRA LAVAL
13.1 REYNOLDS PACKAGING
14 APPENDIX (Page No. - 198)
14.1 DISCUSSION GUIDE
14.2 KNOWLEDGE STORE: MARKETSANDMARKETS’ SUBSCRIPTION PORTAL
14.3 AVAILABLE CUSTOMIZATIONS
14.4 RELATED REPORTS
14.5 AUTHOR DETAILS
LIST OF TABLES (248 Tables)
TABLE 1 YOUTH ENVIRONMENT PROTECTION ORGANIZATIONS
TABLE 2 SINGLE SERVICE JUICE PACKAGING COMPARISON
TABLE 3 SUSTAINABLE PLASTIC PACKAGING MARKET SIZE, BY PACKAGING TYPE, 2018–2025 (USD BILLION)
TABLE 4 SUSTAINABLE PLASTIC PACKAGING MARKET SIZE, BY PACKAGING TYPE, 2018–2025 (MMT)
TABLE 5 SUSTAINABLE PLASTIC PACKAGING MARKET SIZE, BY RIGID PLASTIC PACKAGING, 2018–2025 (USD BILLION)
TABLE 6 SUSTAINABLE PLASTIC PACKAGING MARKET SIZE, BY RIGID PLASTIC PACKAGING, 2018–2025 (MMT)
TABLE 7 SUSTAINABLE PLASTIC PACKAGING MARKET SIZE, BY FLEXIBLE PLASTIC PACKAGING, 2018–2025 (USD BILLION)
TABLE 8 SUSTAINABLE PLASTIC PACKAGING MARKET SIZE, BY FLEXIBLE PLASTIC PACKAGING, 2018–2025 (MMT)
TABLE 9 SUSTAINABLE PLASTIC PACKAGING MARKET SIZE, BY INDUSTRIAL PLASTIC PACKAGING, 2018–2025 (USD BILLION)
TABLE 10 SUSTAINABLE PLASTIC PACKAGING MARKET SIZE, BY INDUSTRIAL PLASTIC PACKAGING, 2018–2025 (MMT)
TABLE 11 SUSTAINABLE PLASTIC PACKAGING MARKET SIZE, BY PACKAGING FORMAT, 2018–2025 (USD BILLION)
TABLE 12 SUSTAINABLE PLASTIC PACKAGING MARKET SIZE, BY PACKAGING FORMAT, 2018–2025 (MMT)
TABLE 13 SUSTAINABLE PLASTIC PACKAGING MARKET SIZE, BY PROCESS, 2018–2025 (USD BILLION)
TABLE 14 SUSTAINABLE PLASTIC PACKAGING MARKET SIZE, BY PROCESS, 2018–2025 (MMT)
TABLE 15 SUSTAINABLE PLASTIC PACKAGING MARKET SIZE, BY END-USE SECTOR, 2018–2025 (USD BILLION)
TABLE 16 SUSTAINABLE PLASTIC PACKAGING MARKET SIZE, BY END-USE SECTOR, 2018–2025 (MMT)
TABLE 17 SUSTAINABLE PLASTIC PACKAGING MARKET SIZE, BY REGION, 2018–2025 (USD BILLION)
TABLE 18 SUSTAINABLE PLASTIC PACKAGING MARKET SIZE, BY REGION, 2018–2025 (MMT)
TABLE 19 SUSTAINABLE PLASTIC PACKAGING MARKET SIZE, BY PACKAGING TYPE, 2018–2025 (USD BILLION)
TABLE 20 SUSTAINABLE PLASTIC PACKAGING MARKET SIZE, BY PACKAGING TYPE, 2018–2025 (MMT)
TABLE 21 SUSTAINABLE PLASTIC PACKAGING MARKET SIZE, BY PACKAGING FORMAT, 2018–2025 (USD BILLION)
TABLE 22 SUSTAINABLE PLASTIC PACKAGING MARKET SIZE, BY PACKAGING FORMAT, 2018–2025 (MMT)
TABLE 23 SUSTAINABLE PLASTIC PACKAGING MARKET SIZE, BY PROCESS, 2018–2025 (USD BILLION)
TABLE 24 SUSTAINABLE PLASTIC PACKAGING MARKET SIZE, BY PROCESS, 2018–2025 (MMT)
TABLE 25 SUSTAINABLE PLASTIC PACKAGING MARKET SIZE, BY END-USE SECTOR, 2018–2025 (USD BILLION)
TABLE 26 SUSTAINABLE PLASTIC PACKAGING MARKET SIZE, BY END-USE SECTOR, 2018–2025 (MMT)
TABLE 27 APAC: SUSTAINABLE PLASTIC PACKAGING MARKET SIZE, BY COUNTRY, 2018–2025 (USD BILLION)
TABLE 28 APAC: SUSTAINABLE PLASTIC PACKAGING MARKET SIZE, BY COUNTRY, 2018–2025 (MMT)
TABLE 29 APAC: SUSTAINABLE PLASTIC PACKAGING MARKET SIZE, BY PACKAGING TYPE, 2018–2025 (USD BILLION)
TABLE 30 APAC: SUSTAINABLE PLASTIC PACKAGING MARKET SIZE, BY PACKAGING TYPE, 2018–2025 (MMT)
TABLE 31 APAC: SUSTAINABLE PLASTIC PACKAGING MARKET SIZE, BY PACKAGING FORMAT, 2018–2025 (USD BILLION)
TABLE 32 APAC: SUSTAINABLE PLASTIC PACKAGING MARKET SIZE, BY PACKAGING FORMAT, 2018–2025 (MMT)
TABLE 33 APAC: SUSTAINABLE PLASTIC PACKAGING MARKET SIZE, BY PROCESS, 2018–2025 (USD BILLION)
TABLE 34 APAC: SUSTAINABLE PLASTIC PACKAGING MARKET SIZE, BY PROCESS, 2018–2025 (MMT)
TABLE 35 APAC: SUSTAINABLE PLASTIC PACKAGING MARKET SIZE, BY END-USE SECTOR, 2018–2025 (USD BILLION)
TABLE 36 APAC: SUSTAINABLE PLASTIC PACKAGING MARKET SIZE, BY END-USE SECTOR, 2018–2025 (MMT)
TABLE 37 CHINA: SUSTAINABLE PLASTIC PACKAGING MARKET SIZE, BY PACKAGING TYPE, 2018–2025 (USD BILLION)
TABLE 38 CHINA: SUSTAINABLE PLASTIC PACKAGING MARKET SIZE, BY PACKAGING TYPE, 2018–2025 (MMT)
TABLE 39 CHINA: SUSTAINABLE PLASTIC PACKAGING MARKET SIZE, BY PACKAGING FORMAT, 2018–2025 (USD BILLION)
TABLE 40 CHINA: SUSTAINABLE PLASTIC PACKAGING MARKET SIZE, BY PACKAGING FORMAT, 2018–2025 (MMT)
TABLE 41 CHINA: SUSTAINABLE PLASTIC PACKAGING MARKET SIZE, BY PROCESS, 2018–2025 (USD BILLION)
TABLE 42 CHINA: SUSTAINABLE PLASTIC PACKAGING MARKET SIZE, BY PROCESS, 2018–2025 (MMT)
TABLE 43 CHINA: SUSTAINABLE PLASTIC PACKAGING MARKET SIZE, BY END-USE SECTOR, 2018–2025 (USD BILLION)
TABLE 44 CHINA: SUSTAINABLE PLASTIC PACKAGING MARKET SIZE, BY END-USE SECTOR, 2018–2025 (MMT)
TABLE 45 JAPAN: SUSTAINABLE PLASTIC PACKAGING MARKET SIZE, BY PACKAGING TYPE, 2018–2025 (USD BILLION)
TABLE 46 JAPAN: SUSTAINABLE PLASTIC PACKAGING MARKET SIZE, BY PACKAGING TYPE, 2018–2025 (MMT)
TABLE 47 JAPAN: SUSTAINABLE PLASTIC PACKAGING MARKET SIZE, BY PACKAGING FORMAT, 2018–2025 (USD BILLION)
TABLE 48 JAPAN: SUSTAINABLE PLASTIC PACKAGING MARKET SIZE, BY PACKAGING FORMAT, 2018–2025 (MMT)
TABLE 49 JAPAN: SUSTAINABLE PLASTIC PACKAGING MARKET SIZE, BY PROCESS, 2018–2025 (USD BILLION)
TABLE 50 JAPAN: SUSTAINABLE PLASTIC PACKAGING MARKET SIZE, BY PROCESS, 2018–2025 (MMT)
TABLE 51 JAPAN: SUSTAINABLE PLASTIC PACKAGING MARKET SIZE, BY END-USE SECTOR, 2018–2025 (USD BILLION)
TABLE 52 JAPAN: SUSTAINABLE PLASTIC PACKAGING MARKET SIZE, BY END-USE SECTOR, 2018–2025 (MMT)
TABLE 53 INDIA: SUSTAINABLE PLASTIC PACKAGING MARKET SIZE, BY PACKAGING TYPE, 2018–2025 (USD BILLION)
TABLE 54 INDIA: SUSTAINABLE PLASTIC PACKAGING MARKET SIZE, BY PACKAGING TYPE, 2018–2025 (MMT)
TABLE 55 INDIA: SUSTAINABLE PLASTIC PACKAGING MARKET SIZE, BY PACKAGING FORMAT, 2018–2025 (USD BILLION)
TABLE 56 INDIA: SUSTAINABLE PLASTIC PACKAGING MARKET SIZE, BY PACKAGING FORMAT, 2018–2025 (MMT)
TABLE 57 INDIA: SUSTAINABLE PLASTIC PACKAGING MARKET SIZE, BY PROCESS, 2018–2025 (USD BILLION)
TABLE 58 INDIA: SUSTAINABLE PLASTIC PACKAGING MARKET SIZE, BY PROCESS, 2018–2025 (MMT)
TABLE 59 INDIA: SUSTAINABLE PLASTIC PACKAGING MARKET SIZE, BY END-USE SECTOR, 2018–2025 (USD BILLION)
TABLE 60 INDIA: SUSTAINABLE PLASTIC PACKAGING MARKET SIZE, BY END-USE SECTOR, 2018–2025 (MMT)
TABLE 61 AUSTRALIA: SUSTAINABLE PLASTIC PACKAGING MARKET SIZE, BY PACKAGING TYPE, 2018–2025 (USD BILLION)
TABLE 62 AUSTRALIA: SUSTAINABLE PLASTIC PACKAGING MARKET SIZE, BY PACKAGING TYPE, 2018–2025 (MMT)
TABLE 63 AUSTRALIA: SUSTAINABLE PLASTIC PACKAGING MARKET SIZE, BY PACKAGING FORMAT, 2018–2025 (USD BILLION)
TABLE 64 AUSTRALIA: SUSTAINABLE PLASTIC PACKAGING MARKET SIZE, BY PACKAGING FORMAT, 2018–2025 (MMT)
TABLE 65 AUSTRALIA: SUSTAINABLE PLASTIC PACKAGING MARKET SIZE, BY PROCESS, 2018–2025 (USD BILLION)
TABLE 66 AUSTRALIA: SUSTAINABLE PLASTIC PACKAGING MARKET SIZE, BY PROCESS, 2018–2025 (MMT)
TABLE 67 AUSTRALIA: SUSTAINABLE PLASTIC PACKAGING MARKET SIZE, BY END-USE SECTOR, 2018–2025 (USD BILLION)
TABLE 68 AUSTRALIA: SUSTAINABLE PLASTIC PACKAGING MARKET SIZE, BY END-USE SECTOR, 2018–2025 (MMT)
TABLE 69 REST OF APAC: SUSTAINABLE PLASTIC PACKAGING MARKET SIZE, BY PACKAGING TYPE, 2018–2025 (USD BILLION)
TABLE 70 REST OF APAC: SUSTAINABLE PLASTIC PACKAGING MARKET SIZE, BY PACKAGING TYPE, 2018–2025 (MMT)
TABLE 71 REST OF APAC: SUSTAINABLE PLASTIC PACKAGING MARKET SIZE, BY PACKAGING FORMAT, 2018–2025 (USD BILLION)
TABLE 72 REST OF APAC: SUSTAINABLE PLASTIC PACKAGING MARKET SIZE, BY PACKAGING FORMAT, 2018–2025 (MMT)
TABLE 73 REST OF APAC: SUSTAINABLE PLASTIC PACKAGING MARKET SIZE, BY PROCESS, 2018–2025 (USD BILLION)
TABLE 74 REST OF APAC: SUSTAINABLE PLASTIC PACKAGING MARKET SIZE, BY PROCESS, 2018–2025 (MMT)
TABLE 75 REST OF APAC: SUSTAINABLE PLASTIC PACKAGING MARKET SIZE, BY END-USE SECTOR, 2018–2025 (USD BILLION)
TABLE 76 REST OF APAC: SUSTAINABLE PLASTIC PACKAGING MARKET SIZE, BY END-USE SECTOR, 2018–2025 (MMT)
TABLE 77 EUROPE: SUSTAINABLE PLASTIC PACKAGING MARKET SIZE, BY COUNTRY, 2018–2025 (USD BILLION)
TABLE 78 EUROPE: SUSTAINABLE PLASTIC PACKAGING MARKET SIZE, BY COUNTRY, 2018–2025 (MMT)
TABLE 79 EUROPE: SUSTAINABLE PLASTIC PACKAGING MARKET SIZE, BY PACKAGING TYPE, 2018–2025 (USD BILLION)
TABLE 80 EUROPE: SUSTAINABLE PLASTIC PACKAGING MARKET SIZE, BY PACKAGING TYPE, 2018–2025 (MMT)
TABLE 81 EUROPE: SUSTAINABLE PLASTIC PACKAGING MARKET SIZE, BY PACKAGING FORMAT, 2018–2025 (USD BILLION)
TABLE 82 EUROPE: SUSTAINABLE PLASTIC PACKAGING MARKET SIZE, BY PACKAGING FORMAT, 2018–2025 (MMT)
TABLE 83 EUROPE: SUSTAINABLE PLASTIC PACKAGING MARKET SIZE, BY PROCESS, 2018–2025 (USD BILLION)
TABLE 84 EUROPE: SUSTAINABLE PLASTIC PACKAGING MARKET SIZE, BY PROCESS, 2018–2025 (MMT)
TABLE 85 EUROPE: SUSTAINABLE PLASTIC PACKAGING MARKET SIZE, BY END-USE SECTOR, 2018–2025 (USD BILLION)
TABLE 86 EUROPE: SUSTAINABLE PLASTIC PACKAGING MARKET SIZE, BY END-USE SECTOR, 2018–2025 (MMT)
TABLE 87 GERMANY: SUSTAINABLE PLASTIC PACKAGING MARKET SIZE, BY PACKAGING TYPE, 2018–2025 (USD BILLION)
TABLE 88 GERMANY: SUSTAINABLE PLASTIC PACKAGING MARKET SIZE, BY PACKAGING TYPE, 2018–2025 (MMT)
TABLE 89 GERMANY: SUSTAINABLE PLASTIC PACKAGING MARKET SIZE, BY PACKAGING FORMAT, 2018–2025 (USD BILLION)
TABLE 90 GERMANY: SUSTAINABLE PLASTIC PACKAGING MARKET SIZE, BY PACKAGING FORMAT, 2018–2025 (MMT)
TABLE 91 GERMANY: SUSTAINABLE PLASTIC PACKAGING MARKET SIZE, BY PROCESS, 2018–2025 (USD BILLION)
TABLE 92 GERMANY: SUSTAINABLE PLASTIC PACKAGING MARKET SIZE, BY PROCESS, 2018–2025 (MMT)
TABLE 93 GERMANY: SUSTAINABLE PLASTIC PACKAGING MARKET SIZE, BY END-USE SECTOR, 2018–2025 (USD BILLION)
TABLE 94 GERMANY: SUSTAINABLE PLASTIC PACKAGING MARKET SIZE, BY END-USE SECTOR, 2018–2025 (MMT)
TABLE 95 UK: SUSTAINABLE PLASTIC PACKAGING MARKET SIZE, BY PACKAGING TYPE, 2018–2025 (USD BILLION)
TABLE 96 UK: SUSTAINABLE PLASTIC PACKAGING MARKET SIZE, BY PACKAGING TYPE, 2018–2025 (MMT)
TABLE 97 UK: SUSTAINABLE PLASTIC PACKAGING MARKET SIZE, BY PACKAGING FORMAT, 2018–2025 (USD BILLION)
TABLE 98 UK: SUSTAINABLE PLASTIC PACKAGING MARKET SIZE, BY PACKAGING FORMAT, 2018–2025 (MMT)
TABLE 99 UK: SUSTAINABLE PLASTIC PACKAGING MARKET SIZE, BY PROCESS, 2018–2025 (USD BILLION)
TABLE 100 UK: SUSTAINABLE PLASTIC PACKAGING MARKET SIZE, BY PROCESS, 2018–2025 (MMT)
TABLE 101 UK: SUSTAINABLE PLASTIC PACKAGING MARKET SIZE, BY END-USE SECTOR, 2018–2025 (USD BILLION)
TABLE 102 UK: SUSTAINABLE PLASTIC PACKAGING MARKET SIZE, BY END-USE SECTOR, 2018–2025 (MMT)
TABLE 103 FRANCE: SUSTAINABLE PLASTIC PACKAGING MARKET SIZE, BY PACKAGING TYPE, 2018–2025 (USD BILLION)
TABLE 104 FRANCE: SUSTAINABLE PLASTIC PACKAGING MARKET SIZE, BY PACKAGING TYPE, 2018–2025 (MMT)
TABLE 105 FRANCE: SUSTAINABLE PLASTIC PACKAGING MARKET SIZE, BY PACKAGING FORMAT, 2018–2025 (USD BILLION)
TABLE 106 FRANCE: SUSTAINABLE PLASTIC PACKAGING MARKET SIZE, BY PACKAGING FORMAT, 2018–2025 (MMT)
TABLE 107 FRANCE: SUSTAINABLE PLASTIC PACKAGING MARKET SIZE, BY PROCESS, 2018–2025 (USD BILLION)
TABLE 108 FRANCE: SUSTAINABLE PLASTIC PACKAGING MARKET SIZE, BY PROCESS, 2018–2025 (MMT)
TABLE 109 FRANCE: SUSTAINABLE PLASTIC PACKAGING MARKET SIZE, BY END-USE SECTOR, 2018–2025 (USD BILLION)
TABLE 110 FRANCE: SUSTAINABLE PLASTIC PACKAGING MARKET SIZE, BY END-USE SECTOR, 2018–2025 (MMT)
TABLE 111 RUSSIA: SUSTAINABLE PLASTIC PACKAGING MARKET SIZE, BY PACKAGING TYPE, 2018–2025 (USD BILLION)
TABLE 112 RUSSIA: SUSTAINABLE PLASTIC PACKAGING MARKET SIZE, BY PACKAGING TYPE, 2018–2025 (MMT)
TABLE 113 RUSSIA: SUSTAINABLE PLASTIC PACKAGING MARKET SIZE, BY PACKAGING FORMAT, 2018–2025 (USD BILLION)
TABLE 114 RUSSIA: SUSTAINABLE PLASTIC PACKAGING MARKET SIZE, BY PACKAGING FORMAT, 2018–2025 (MMT)
TABLE 115 RUSSIA: SUSTAINABLE PLASTIC PACKAGING MARKET SIZE, BY PROCESS, 2018–2025 (USD BILLION)
TABLE 116 RUSSIA: SUSTAINABLE PLASTIC PACKAGING MARKET SIZE, BY PROCESS, 2018–2025 (MMT)
TABLE 117 RUSSIA: SUSTAINABLE PLASTIC PACKAGING MARKET SIZE, BY END-USE SECTOR, 2018–2025 (USD BILLION)
TABLE 118 RUSSIA: SUSTAINABLE PLASTIC PACKAGING MARKET SIZE, BY END-USE SECTOR, 2018–2025 (MMT)
TABLE 119 SPAIN: SUSTAINABLE PLASTIC PACKAGING MARKET SIZE, BY PACKAGING TYPE, 2018–2025 (USD BILLION)
TABLE 120 SPAIN: SUSTAINABLE PLASTIC PACKAGING MARKET SIZE, BY PACKAGING TYPE, 2018–2025 (MMT)
TABLE 121 SPAIN: SUSTAINABLE PLASTIC PACKAGING MARKET SIZE, BY PACKAGING FORMAT, 2018–2025 (USD BILLION)
TABLE 122 SPAIN: SUSTAINABLE PLASTIC PACKAGING MARKET SIZE, BY PACKAGING FORMAT, 2018–2025 (MMT)
TABLE 123 SPAIN: SUSTAINABLE PLASTIC PACKAGING MARKET SIZE, BY PROCESS, 2018–2025 (USD BILLION)
TABLE 124 SPAIN: SUSTAINABLE PLASTIC PACKAGING MARKET SIZE, BY PROCESS, 2018–2025 (MMT)
TABLE 125 SPAIN: SUSTAINABLE PLASTIC PACKAGING MARKET SIZE, BY END-USE SECTOR, 2018–2025 (USD BILLION)
TABLE 126 SPAIN: SUSTAINABLE PLASTIC PACKAGING MARKET SIZE, BY END-USE SECTOR, 2018–2025 (MMT)
TABLE 127 REST OF EUROPE: SUSTAINABLE PLASTIC PACKAGING MARKET SIZE, BY PACKAGING TYPE, 2018–2025 (USD BILLION)
TABLE 128 REST OF EUROPE: SUSTAINABLE PLASTIC PACKAGING MARKET SIZE, BY PACKAGING TYPE, 2018–2025 (MMT)
TABLE 129 REST OF EUROPE: SUSTAINABLE PLASTIC PACKAGING MARKET SIZE, BY PACKAGING FORMAT, 2018–2025 (USD BILLION)
TABLE 130 REST OF EUROPE: SUSTAINABLE PLASTIC PACKAGING MARKET SIZE, BY PACKAGING FORMAT, 2018–2025 (MMT)
TABLE 131 REST OF EUROPE: SUSTAINABLE PLASTIC PACKAGING MARKET SIZE, BY PROCESS, 2018–2025 (USD BILLION)
TABLE 132 REST OF EUROPE: SUSTAINABLE PLASTIC PACKAGING MARKET SIZE, BY PROCESS, 2018–2025 (MMT)
TABLE 133 REST OF EUROPE: SUSTAINABLE PLASTIC PACKAGING MARKET SIZE, BY END-USE SECTOR, 2018–2025 (USD BILLION)
TABLE 134 REST OF EUROPE: SUSTAINABLE PLASTIC PACKAGING MARKET SIZE, BY END-USE SECTOR, 2018–2025 (MMT)
TABLE 135 NORTH AMERICA: SUSTAINABLE PLASTIC PACKAGING MARKET SIZE, BY COUNTRY, 2018–2025 (USD BILLION)
TABLE 136 NORTH AMERICA: SUSTAINABLE PLASTIC PACKAGING MARKET SIZE, BY COUNTRY, 2018–2025 (MMT)
TABLE 137 NORTH AMERICA: SUSTAINABLE PLASTIC PACKAGING MARKET SIZE, BY PACKAGING TYPE, 2018–2025 (USD BILLION)
TABLE 138 NORTH AMERICA: SUSTAINABLE PLASTIC PACKAGING MARKET SIZE, BY PACKAGING TYPE, 2018–2025 (MMT)
TABLE 139 NORTH AMERICA: SUSTAINABLE PLASTIC PACKAGING MARKET SIZE, BY PACKAGING FORMAT, 2018–2025 (USD BILLION)
TABLE 140 NORTH AMERICA: SUSTAINABLE PLASTIC PACKAGING MARKET SIZE, BY PACKAGING FORMAT, 2018–2025 (MMT)
TABLE 141 NORTH AMERICA: SUSTAINABLE PLASTIC PACKAGING MARKET SIZE, BY PROCESS, 2018–2025 (USD BILLION)
TABLE 142 NORTH AMERICA: SUSTAINABLE PLASTIC PACKAGING MARKET SIZE, BY PROCESS, 2018–2025 (MMT)
TABLE 143 NORTH AMERICA: SUSTAINABLE PLASTIC PACKAGING MARKET SIZE, BY END-USE SECTOR, 2018–2025 (USD BILLION)
TABLE 144 NORTH AMERICA: SUSTAINABLE PLASTIC PACKAGING MARKET SIZE, BY END-USE SECTOR, 2018–2025 (MMT)
TABLE 145 US: SUSTAINABLE PLASTIC PACKAGING MARKET SIZE, BY PACKAGING TYPE, 2018–2025 (USD BILLION)
TABLE 146 US: SUSTAINABLE PLASTIC PACKAGING MARKET SIZE, BY PACKAGING TYPE, 2018–2025 (MMT)
TABLE 147 US: SUSTAINABLE PLASTIC PACKAGING MARKET SIZE, BY PACKAGING FORMAT, 2018–2025 (USD BILLION)
TABLE 148 US: SUSTAINABLE PLASTIC PACKAGING MARKET SIZE, BY PACKAGING FORMAT, 2018–2025 (MMT)
TABLE 149 US: SUSTAINABLE PLASTIC PACKAGING MARKET SIZE, BY PROCESS, 2018–2025 (USD BILLION)
TABLE 150 US: SUSTAINABLE PLASTIC PACKAGING MARKET SIZE, BY PROCESS, 2018–2025 (MMT)
TABLE 151 US: SUSTAINABLE PLASTIC PACKAGING MARKET SIZE, BY END-USE SECTOR, 2018–2025 (USD BILLION)
TABLE 152 US: SUSTAINABLE PLASTIC PACKAGING MARKET SIZE, BY END-USE SECTOR, 2018–2025 (MMT)
TABLE 153 CANADA: SUSTAINABLE PLASTIC PACKAGING MARKET SIZE, BY PACKAGING TYPE, 2018–2025 (USD BILLION)
TABLE 154 CANADA: SUSTAINABLE PLASTIC PACKAGING MARKET SIZE, BY PACKAGING TYPE, 2018–2025 (MMT)
TABLE 155 CANADA: SUSTAINABLE PLASTIC PACKAGING MARKET SIZE, BY PACKAGING FORMAT, 2018–2025 (USD BILLION)
TABLE 156 CANADA: SUSTAINABLE PLASTIC PACKAGING MARKET SIZE, BY PACKAGING FORMAT, 2018–2025 (MMT)
TABLE 157 CANADA: SUSTAINABLE PLASTIC PACKAGING MARKET SIZE, BY PROCESS, 2018–2025 (USD BILLION)
TABLE 158 CANADA: SUSTAINABLE PLASTIC PACKAGING MARKET SIZE, BY PROCESS, 2018–2025 (MMT)
TABLE 159 CANADA: SUSTAINABLE PLASTIC PACKAGING MARKET SIZE, BY END-USE SECTOR, 2018–2025 (USD BILLION)
TABLE 160 CANADA: SUSTAINABLE PLASTIC PACKAGING MARKET SIZE, BY END-USE SECTOR, 2018–2025 (MMT)
TABLE 161 MEXICO: SUSTAINABLE PLASTIC PACKAGING MARKET SIZE, BY PACKAGING TYPE, 2018–2025 (USD BILLION)
TABLE 162 MEXICO: SUSTAINABLE PLASTIC PACKAGING MARKET SIZE, BY PACKAGING TYPE, 2018–2025 (MMT)
TABLE 163 MEXICO: SUSTAINABLE PLASTIC PACKAGING MARKET SIZE, BY PACKAGING FORMAT, 2018–2025 (USD BILLION)
TABLE 164 MEXICO: SUSTAINABLE PLASTIC PACKAGING MARKET SIZE, BY PACKAGING FORMAT, 2018–2025 (MMT)
TABLE 165 MEXICO: SUSTAINABLE PLASTIC PACKAGING MARKET SIZE, BY PROCESS, 2018–2025 (USD BILLION)
TABLE 166 MEXICO: SUSTAINABLE PLASTIC PACKAGING MARKET SIZE, BY PROCESS, 2018–2025 (MMT)
TABLE 167 MEXICO: SUSTAINABLE PLASTIC PACKAGING MARKET SIZE, BY END-USE SECTOR, 2018–2025 (USD BILLION)
TABLE 168 MEXICO: SUSTAINABLE PLASTIC PACKAGING MARKET SIZE, BY END-USE SECTOR, 2018–2025 (MMT)
TABLE 169 MIDDLE EAST & AFRICA: SUSTAINABLE PLASTIC PACKAGING MARKET SIZE, BY COUNTRY, 2018–2025 (USD BILLION)
TABLE 170 MIDDLE EAST & AFRICA: SUSTAINABLE PLASTIC PACKAGING MARKET SIZE, BY COUNTRY, 2018–2025 (MMT)
TABLE 171 MIDDLE EAST & AFRICA: SUSTAINABLE PLASTIC PACKAGING MARKET SIZE, BY PACKAGING TYPE, 2018–2025 (USD BILLION)
TABLE 172 MIDDLE EAST & AFRICA: SUSTAINABLE PLASTIC PACKAGING MARKET SIZE, BY PACKAGING TYPE, 2018–2025 (MMT)
TABLE 173 MIDDLE EAST & AFRICA: SUSTAINABLE PLASTIC PACKAGING MARKET SIZE, BY PACKAGING FORMAT, 2018–2025 (USD BILLION)
TABLE 174 MIDDLE EAST & AFRICA: SUSTAINABLE PLASTIC PACKAGING MARKET SIZE, BY PACKAGING FORMAT, 2018–2025 (MMT)
TABLE 175 MIDDLE EAST & AFRICA: SUSTAINABLE PLASTIC PACKAGING MARKET SIZE, BY PROCESS, 2018–2025 (USD BILLION)
TABLE 176 MIDDLE EAST & AFRICA: SUSTAINABLE PLASTIC PACKAGING MARKET SIZE, BY PROCESS, 2018–2025 (MMT)
TABLE 177 MIDDLE EAST & AFRICA: SUSTAINABLE PLASTIC PACKAGING MARKET SIZE, BY END-USE SECTOR, 2018–2025 (USD BILLION)
TABLE 178 MIDDLE EAST & AFRICA: SUSTAINABLE PLASTIC PACKAGING MARKET SIZE, BY END-USE SECTOR, 2018–2025 (MMT)
TABLE 179 UAE: SUSTAINABLE PLASTIC PACKAGING MARKET SIZE, BY PACKAGING TYPE, 2018–2025 (USD BILLION)
TABLE 180 UAE: SUSTAINABLE PLASTIC PACKAGING MARKET SIZE, BY PACKAGING TYPE, 2018–2025 (MMT)
TABLE 181 UAE: SUSTAINABLE PLASTIC PACKAGING MARKET SIZE, BY PACKAGING FORMAT, 2018–2025 (USD BILLION)
TABLE 182 UAE: SUSTAINABLE PLASTIC PACKAGING MARKET SIZE, BY PACKAGING FORMAT, 2018–2025 (MMT)
TABLE 183 UAE: SUSTAINABLE PLASTIC PACKAGING MARKET SIZE, BY PROCESS, 2018–2025 (USD BILLION)
TABLE 184 UAE: SUSTAINABLE PLASTIC PACKAGING MARKET SIZE, BY PROCESS, 2018–2025 (MMT)
TABLE 185 UAE: SUSTAINABLE PLASTIC PACKAGING MARKET SIZE, BY END-USE SECTOR, 2018–2025 (USD BILLION)
TABLE 186 UAE: SUSTAINABLE PLASTIC PACKAGING MARKET SIZE, BY END-USE SECTOR, 2018–2025 (MMT)
TABLE 187 SAUDI ARABIA: SUSTAINABLE PLASTIC PACKAGING MARKET SIZE, BY PACKAGING TYPE, 2018–2025 (USD BILLION)
TABLE 188 SAUDI ARABIA: SUSTAINABLE PLASTIC PACKAGING MARKET SIZE, BY PACKAGING TYPE, 2018–2025 (MMT)
TABLE 189 SAUDI ARABIA: SUSTAINABLE PLASTIC PACKAGING MARKET SIZE, BY PACKAGING FORMAT, 2018–2025 (USD BILLION)
TABLE 190 SAUDI ARABIA: SUSTAINABLE PLASTIC PACKAGING MARKET SIZE, BY PACKAGING FORMAT, 2018–2025 (MMT)
TABLE 191 SAUDI ARABIA: SUSTAINABLE PLASTIC PACKAGING MARKET SIZE, BY PROCESS, 2018–2025 (USD BILLION)
TABLE 192 SAUDI ARABIA: SUSTAINABLE PLASTIC PACKAGING MARKET SIZE, BY PROCESS, 2018–2025 (MMT)
TABLE 193 SAUDI ARABIA: SUSTAINABLE PLASTIC PACKAGING MARKET SIZE, BY END-USE SECTOR, 2018–2025 (USD BILLION)
TABLE 194 SAUDI ARABIA: SUSTAINABLE PLASTIC PACKAGING MARKET SIZE, BY END-USE SECTOR, 2018–2025 (MMT)
TABLE 195 SOUTH AFRICA: SUSTAINABLE PLASTIC PACKAGING MARKET SIZE, BY PACKAGING TYPE, 2018–2025 (USD BILLION)
TABLE 196 SOUTH AFRICA: SUSTAINABLE PLASTIC PACKAGING MARKET SIZE, BY PACKAGING TYPE, 2018–2025 (MMT)
TABLE 197 SOUTH AFRICA: SUSTAINABLE PLASTIC PACKAGING MARKET SIZE, BY PACKAGING FORMAT, 2018–2025 (USD BILLION)
TABLE 198 SOUTH AFRICA: SUSTAINABLE PLASTIC PACKAGING MARKET SIZE, BY PACKAGING FORMAT, 2018–2025 (MMT)
TABLE 199 SOUTH AFRICA: SUSTAINABLE PLASTIC PACKAGING MARKET SIZE, BY PROCESS, 2018–2025 (USD BILLION)
TABLE 200 SOUTH AFRICA: SUSTAINABLE PLASTIC PACKAGING MARKET SIZE, BY PROCESS, 2018–2025 (MMT)
TABLE 201 SOUTH AFRICA: SUSTAINABLE PLASTIC PACKAGING MARKET SIZE, BY END-USE SECTOR, 2018–2025 (USD BILLION)
TABLE 202 SOUTH AFRICA: SUSTAINABLE PLASTIC PACKAGING MARKET SIZE, BY END-USE SECTOR, 2018–2025 (MMT)
TABLE 203 REST OF MIDDLE EAST & AFRICA: SUSTAINABLE PLASTIC PACKAGING MARKET SIZE, BY PACKAGING TYPE, 2018–2025 (USD BILLION)
TABLE 204 REST OF MIDDLE EAST & AFRICA: SUSTAINABLE PLASTIC PACKAGING MARKET SIZE, BY PACKAGING TYPE, 2018–2025 (MMT)
TABLE 205 REST OF MIDDLE EAST & AFRICA: SUSTAINABLE PLASTIC PACKAGING MARKET SIZE, BY PACKAGING FORMAT, 2018–2025 (USD BILLION)
TABLE 206 REST OF MIDDLE EAST & AFRICA: SUSTAINABLE PLASTIC PACKAGING MARKET SIZE, BY PACKAGING FORMAT, 2018–2025 (MMT)
TABLE 207 REST OF MIDDLE EAST & AFRICA: SUSTAINABLE PLASTIC PACKAGING MARKET SIZE, BY PROCESS, 2018–2025 (USD BILLION)
TABLE 208 REST OF MIDDLE EAST & AFRICA: SUSTAINABLE PLASTIC PACKAGING MARKET SIZE, BY PROCESS, 2018–2025 (MMT)
TABLE 209 REST OF MIDDLE EAST & AFRICA: SUSTAINABLE PLASTIC PACKAGING MARKET SIZE, BY END-USE SECTOR, 2018–2025 (USD BILLION)
TABLE 210 REST OF MIDDLE EAST & AFRICA: SUSTAINABLE PLASTIC PACKAGING MARKET SIZE, BY END-USE SECTOR, 2018–2025 (MMT)
TABLE 211 SOUTH AMERICA: SUSTAINABLE PLASTIC PACKAGING MARKET SIZE, BY COUNTRY, 2018–2025 (USD BILLION)
TABLE 212 SOUTH AMERICA: SUSTAINABLE PLASTIC PACKAGING MARKET SIZE, BY COUNTRY, 2018–2025 (MMT)
TABLE 213 SOUTH AMERICA: SUSTAINABLE PLASTIC PACKAGING MARKET SIZE, BY PACKAGING TYPE, 2018–2025 (USD BILLION)
TABLE 214 SOUTH AMERICA: SUSTAINABLE PLASTIC PACKAGING MARKET SIZE, BY PACKAGING TYPE, 2018–2025 (MMT)
TABLE 215 SOUTH AMERICA: SUSTAINABLE PLASTIC PACKAGING MARKET SIZE, BY PACKAGING FORMAT, 2018–2025 (USD BILLION)
TABLE 216 SOUTH AMERICA: SUSTAINABLE PLASTIC PACKAGING MARKET SIZE, BY PACKAGING FORMAT, 2018–2025 (MMT)
TABLE 217 SOUTH AMERICA: SUSTAINABLE PLASTIC PACKAGING MARKET SIZE, BY PROCESS, 2018–2025 (USD BILLION)
TABLE 218 SOUTH AMERICA: SUSTAINABLE PLASTIC PACKAGING MARKET SIZE, BY PROCESS, 2018–2025 (MMT)
TABLE 219 SOUTH AMERICA: SUSTAINABLE PLASTIC PACKAGING MARKET SIZE, BY END-USE SECTOR, 2018–2025 (USD BILLION)
TABLE 220 SOUTH AMERICA: SUSTAINABLE PLASTIC PACKAGING MARKET SIZE, BY END-USE SECTOR, 2018–2025 (MMT)
TABLE 221 BRAZIL: SUSTAINABLE PLASTIC PACKAGING MARKET SIZE, BY PACKAGING TYPE, 2018–2025 (USD BILLION)
TABLE 222 BRAZIL: SUSTAINABLE PLASTIC PACKAGING MARKET SIZE, BY PACKAGING TYPE, 2018–2025 (MMT)
TABLE 223 BRAZIL: SUSTAINABLE PLASTIC PACKAGING MARKET SIZE, BY PACKAGING FORMAT, 2018–2025 (USD BILLION)
TABLE 224 BRAZIL: SUSTAINABLE PLASTIC PACKAGING MARKET SIZE, BY PACKAGING FORMAT, 2018–2025 (MMT)
TABLE 225 BRAZIL: SUSTAINABLE PLASTIC PACKAGING MARKET SIZE, BY PROCESS, 2018–2025 (USD BILLION)
TABLE 226 BRAZIL: SUSTAINABLE PLASTIC PACKAGING MARKET SIZE, BY PROCESS, 2018–2025 (MMT)
TABLE 227 BRAZIL: SUSTAINABLE PLASTIC PACKAGING MARKET SIZE, BY END-USE SECTOR, 2018–2025 (USD BILLION)
TABLE 228 BRAZIL: SUSTAINABLE PLASTIC PACKAGING MARKET SIZE, BY END-USE SECTOR, 2018–2025 (MMT)
TABLE 229 ARGENTINA: SUSTAINABLE PLASTIC PACKAGING MARKET SIZE, BY PACKAGING TYPE, 2018–2025 (USD BILLION)
TABLE 230 ARGENTINA: SUSTAINABLE PLASTIC PACKAGING MARKET SIZE, BY PACKAGING TYPE, 2018–2025 (MMT)
TABLE 231 ARGENTINA: SUSTAINABLE PLASTIC PACKAGING MARKET SIZE, BY PACKAGING FORMAT, 2018–2025 (USD BILLION)
TABLE 232 ARGENTINA: SUSTAINABLE PLASTIC PACKAGING MARKET SIZE, BY PACKAGING FORMAT, 2018–2025 (MMT)
TABLE 233 ARGENTINA: SUSTAINABLE PLASTIC PACKAGING MARKET SIZE, BY PROCESS, 2018–2025 (USD BILLION)
TABLE 234 ARGENTINA: SUSTAINABLE PLASTIC PACKAGING MARKET SIZE, BY PROCESS, 2018–2025 (MMT)
TABLE 235 ARGENTINA: SUSTAINABLE PLASTIC PACKAGING MARKET SIZE, BY END-USE SECTOR, 2018–2025 (USD BILLION)
TABLE 236 ARGENTINA: SUSTAINABLE PLASTIC PACKAGING MARKET SIZE, BY END-USE SECTOR, 2018–2025 (MMT)
TABLE 237 REST OF SOUTH AMERICA: SUSTAINABLE PLASTIC PACKAGING MARKET SIZE, BY PACKAGING TYPE, 2018–2025 (USD BILLION)
TABLE 238 REST OF SOUTH AMERICA: SUSTAINABLE PLASTIC PACKAGING MARKET SIZE, BY PACKAGING TYPE, 2018–2025 (MMT)
TABLE 239 REST OF SOUTH AMERICA: SUSTAINABLE PLASTIC PACKAGING MARKET SIZE, BY PACKAGING FORMAT, 2018–2025 (USD BILLION)
TABLE 240 REST OF SOUTH AMERICA: SUSTAINABLE PLASTIC PACKAGING MARKET SIZE, BY PACKAGING FORMAT, 2018–2025 (MMT)
TABLE 241 REST OF SOUTH AMERICA: SUSTAINABLE PLASTIC PACKAGING MARKET SIZE, BY PROCESS, 2018–2025 (USD BILLION)
TABLE 242 REST OF SOUTH AMERICA: SUSTAINABLE PLASTIC PACKAGING MARKET SIZE, BY PROCESS, 2018–2025 (MMT)
TABLE 243 REST OF SOUTH AMERICA: SUSTAINABLE PLASTIC PACKAGING MARKET SIZE, BY END-USE SECTOR, 2018–2025 (USD BILLION)
TABLE 244 REST OF SOUTH AMERICA: SUSTAINABLE PLASTIC PACKAGING MARKET SIZE, BY END-USE SECTOR, 2018–2025 (MMT)
TABLE 245 MERGERS & ACQUISITIONS
TABLE 246 EXPANSIONS & INVESTMENTS
TABLE 247 PARTNERSHIPS & JOINT VENTURES
TABLE 248 NEW PRODUCT DEVELOPMENTS
LIST OF FIGURES (44 Figures)
FIGURE 1 SUSTAINABLE PLASTIC PACKAGING: MARKET SEGMENTATION
FIGURE 2 SUSTAINABLE PLASTIC PACKAGING, BY REGION
FIGURE 3 SUSTAINABLE PLASTIC PACKAGING MARKET: BOTTOM-UP APPROACH
FIGURE 4 SUSTAINABLE PLASTIC PACKAGING MARKET: TOP-DOWN APPROACH
FIGURE 5 RIGID SEGMENT TO ACCOUNT FOR THE LARGEST SHARE IN THE SUSTAINABLE PLASTIC PACKAGING MARKET
FIGURE 6 TERTIARY SEGMENT TO GROW AT THE HIGHEST CAGR IN THE SUSTAINABLE PLASTIC PACKAGING MARKET
FIGURE 7 BIODEGRADABLE SEGMENT TO GROW AT THE HIGHEST CAGR IN THE SUSTAINABLE PLASTIC PACKAGING MARKET
FIGURE 8 FOOD & BEVERAGE SEGMENT TO ACCOUNT FOR THE LARGEST SHARE IN THE SUSTAINABLE PLASTIC PACKAGING MARKET
FIGURE 9 APAC LED THE SUSTAINABLE PLASTIC PACKAGING MARKET IN 2019
FIGURE 10 FOOD & BEVERAGE PACKAGING OFFER ATTRACTIVE OPPORTUNITIES IN THE SUSTAINABLE PLASTIC PACKAGING MARKET
FIGURE 11 CHINA WAS THE LARGEST MARKET FOR SUSTAINABLE PLASTIC PACKAGING MARKET IN 2019
FIGURE 12 INDIA TO BE THE FASTEST-GROWING SUSTAINABLE PLASTIC PACKAGING MARKET
FIGURE 13 DRIVERS, RESTRAINTS, OPPORTUNITIES, AND CHALLENGES IN THE SUSTAINABLE PLASTIC PACKAGING MARKET
FIGURE 14 ONLINE RETAIL SALES
FIGURE 15 FLUCTUATIONS IN PRICES OF NATURAL GAS FROM 2016 TO 2020
FIGURE 16 SUSTAINABLE PLASTIC PACKAGING MARKET SIZE, BY PACKAGING TYPE, 2020 VS. 2025 (USD BILLION)
FIGURE 17 SUSTAINABLE PLASTIC PACKAGING MARKET SIZE, BY PACKAGING FORMAT, 2020 VS. 2025 (USD BILLION)
FIGURE 18 SUSTAINABLE PLASTIC PACKAGING MARKET SIZE, BY PROCESS, 2020 VS. 2025 (USD BILLION)
FIGURE 19 SUSTAINABLE PLASTIC PACKAGING MARKET SIZE, BY END-USE SECTOR, 2020 VS. 2025 (USD BILLION)
FIGURE 20 REGIONAL SNAPSHOT: INDIA TO BE THE FASTEST-GROWING COUNTRY-LEVEL MARKET, 2020–2025
FIGURE 21 APAC: SUSTAINABLE PLASTIC PACKAGING MARKET SNAPSHOT
FIGURE 22 COMPANIES ADOPTED NEW PRODUCT DEVELOPMENTS AND MERGERS & ACQUISITIONS AS THE KEY GROWTH STRATEGIES
FIGURE 23 AMCOR PLC: COMPANY SNAPSHOT
FIGURE 24 SWOT ANALYSIS: AMCOR PLC
FIGURE 25 WINNING IMPERATIVES: AMCOR PLC
FIGURE 26 SONOCO PRODUCTS COMPANY: COMPANY SNAPSHOT
FIGURE 27 SWOT ANALYSIS: SONOCO PRODUCTS COMPANY
FIGURE 28 WINNING IMPERATIVES: SONOCO PRODUCTS COMPANY
FIGURE 29 SEALED AIR CORPORATION: COMPANY SNAPSHOT
FIGURE 30 SWOT ANALYSIS: SEALED AIR CORPORATION
FIGURE 31 WINNING IMPERATIVES: SEALED AIR CORPORATION
FIGURE 32 HUHTAMAKI OYJ: COMPANY SNAPSHOT
FIGURE 33 SWOT ANALYSIS: HUHTAMAKI OYJ
FIGURE 34 WINNING IMPERATIVES: HUHTAMAKI OYJ
FIGURE 35 BERRY GLOBAL GROUP, INC.: COMPANY SNAPSHOT
FIGURE 36 SWOT ANALYSIS: BERRY GLOBAL
FIGURE 37 WINNING IMPERATIVES: BERRY GLOBAL GROUP INC.
FIGURE 38 SMURFIT KAPPA: COMPANY SNAPSHOT
FIGURE 39 SWOT ANALYSIS: SMURFIT KAPPA
FIGURE 40 WINNING IMPERATIVES: SMURFIT KAPPA
FIGURE 41 MONDI: COMPANY SNAPSHOT
FIGURE 42 UFLEX LTD.: COMPANY SNAPSHOT
FIGURE 43 CONSTANTIA FLEXIBLES: COMPANY SNAPSHOT
FIGURE 44 APTARGROUP: COMPANY SNAPSHOT
The study involved four major activities for estimating the current global size of the sustainable plastic packaging market. The exhaustive secondary research was carried out to collect information on the market, the peer market, and the parent market. The next step was to validate these findings, assumptions, and sizes with the industry experts across the value chain of sustainable plastic packaging through primary research. Both the top-down and bottom-up approaches were employed to estimate the overall size of the sustainable plastic packaging market. Thereafter, market breakdown and data triangulation procedures were used to estimate the size of different segments and sub-segments of the market.
Secondary Research
In the secondary research process, various secondary sources such as Hoovers, Factiva, Bloomberg BusinessWeek, and Dun & Bradstreet were referred to, so as to identify and collect information for this study on the sustainable plastic packaging market. These secondary sources included annual reports, press releases & investor presentations of companies, white papers, certified publications, articles by recognized authors, regulatory bodies, trade directories, and databases.
Primary Research
Various primary sources from both the supply and demand sides of the sustainable plastic packaging market were interviewed to obtain qualitative and quantitative information. The primary sources from the supply-side included industry experts, such as Chief Executive Officers (CEOs), vice presidents, marketing directors, sales professionals, and related key executives from various leading companies and organizations operating in the sustainable plastic packaging industry. The primary sources from the demand-side included key executives from banks, government organizations, and educational institutions.
The breakdown of the profiles of primary respondents is as follows:
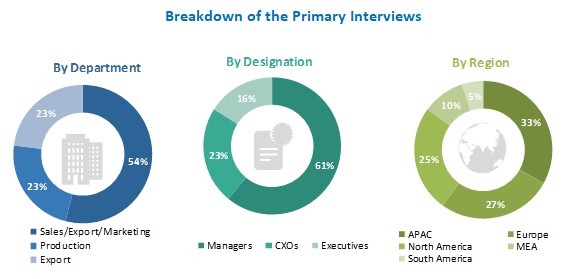
To know about the assumptions considered for the study, download the pdf brochure
Market Size Estimation
Both the top-down and bottom-up approaches were used to estimate and validate the global size of the sustainable plastic packaging market. These approaches were also used extensively to estimate the size of various dependent segments of the market. The research methodology used to estimate the market size included the following details:
- The key players were identified through extensive secondary research.
- The industry’s supply chain and market size, in terms of value, were determined through primary and secondary research processes.
- All percentage shares, splits, and breakdowns were determined using secondary sources and verified through primary sources.
Data Triangulation
After arriving at the overall market size from the estimation process explained above, the total market was split into several segments and sub-segments. The data triangulation and market breakdown procedures were employed, wherever applicable, to complete the overall market engineering process and arrive at the exact statistics for all segments and sub-segments of the sustainable plastic packaging market. The data was triangulated by studying various factors and trends from both the demand- and supply-side.
Research Objectives
- To define, describe, and forecast the sustainable plastic packaging market, in terms of value and volume
- To provide detailed information about the key factors, such as drivers, restraints, opportunities, and challenges, influencing the growth of the market
- To analyze and project the global sustainable plastic packaging market based on packaging type, packaging format, process, end-use sector, and region
- To project the size of the market and its segments for five main regions: North America, Europe, Asia Pacific (APAC), the Middle East & Africa, and South America (along with their respective key countries)
- To strategically analyze micromarkets with respect to individual growth trends, prospects, and their contribution to the total sustainable plastic packaging market
- To analyze the opportunities in the market for stakeholders and provide a detailed competitive landscape of the market leaders
- To strategically profile the key players and comprehensively analyze their market rankings and core competencies
- To track and analyze competitive developments, such as expansions & investments, mergers & acquisitions, new product developments, and partnerships & joint ventures, in the sustainable plastic packaging market
Available Customizations
With the given market data, MarketsandMarkets offers customizations according to client-specific needs.
The following customization options are available for the sustainable plastic packaging report:
Product Analysis
- Product matrix, which offers a detailed comparison of the product portfolio of companies
Regional Analysis
- Further analysis of the sustainable plastic packaging market for additional countries
Company Information
- Detailed analysis and profiling of additional market players (up to five)


Growth opportunities and latent adjacency in Sustainable Plastic Packaging Market